Modern Market Analysis using Depth, Motion and Spatial Feedback
Browser-based 3D charting and order-flow analysis for prop firm futures traders — real-time market data included.
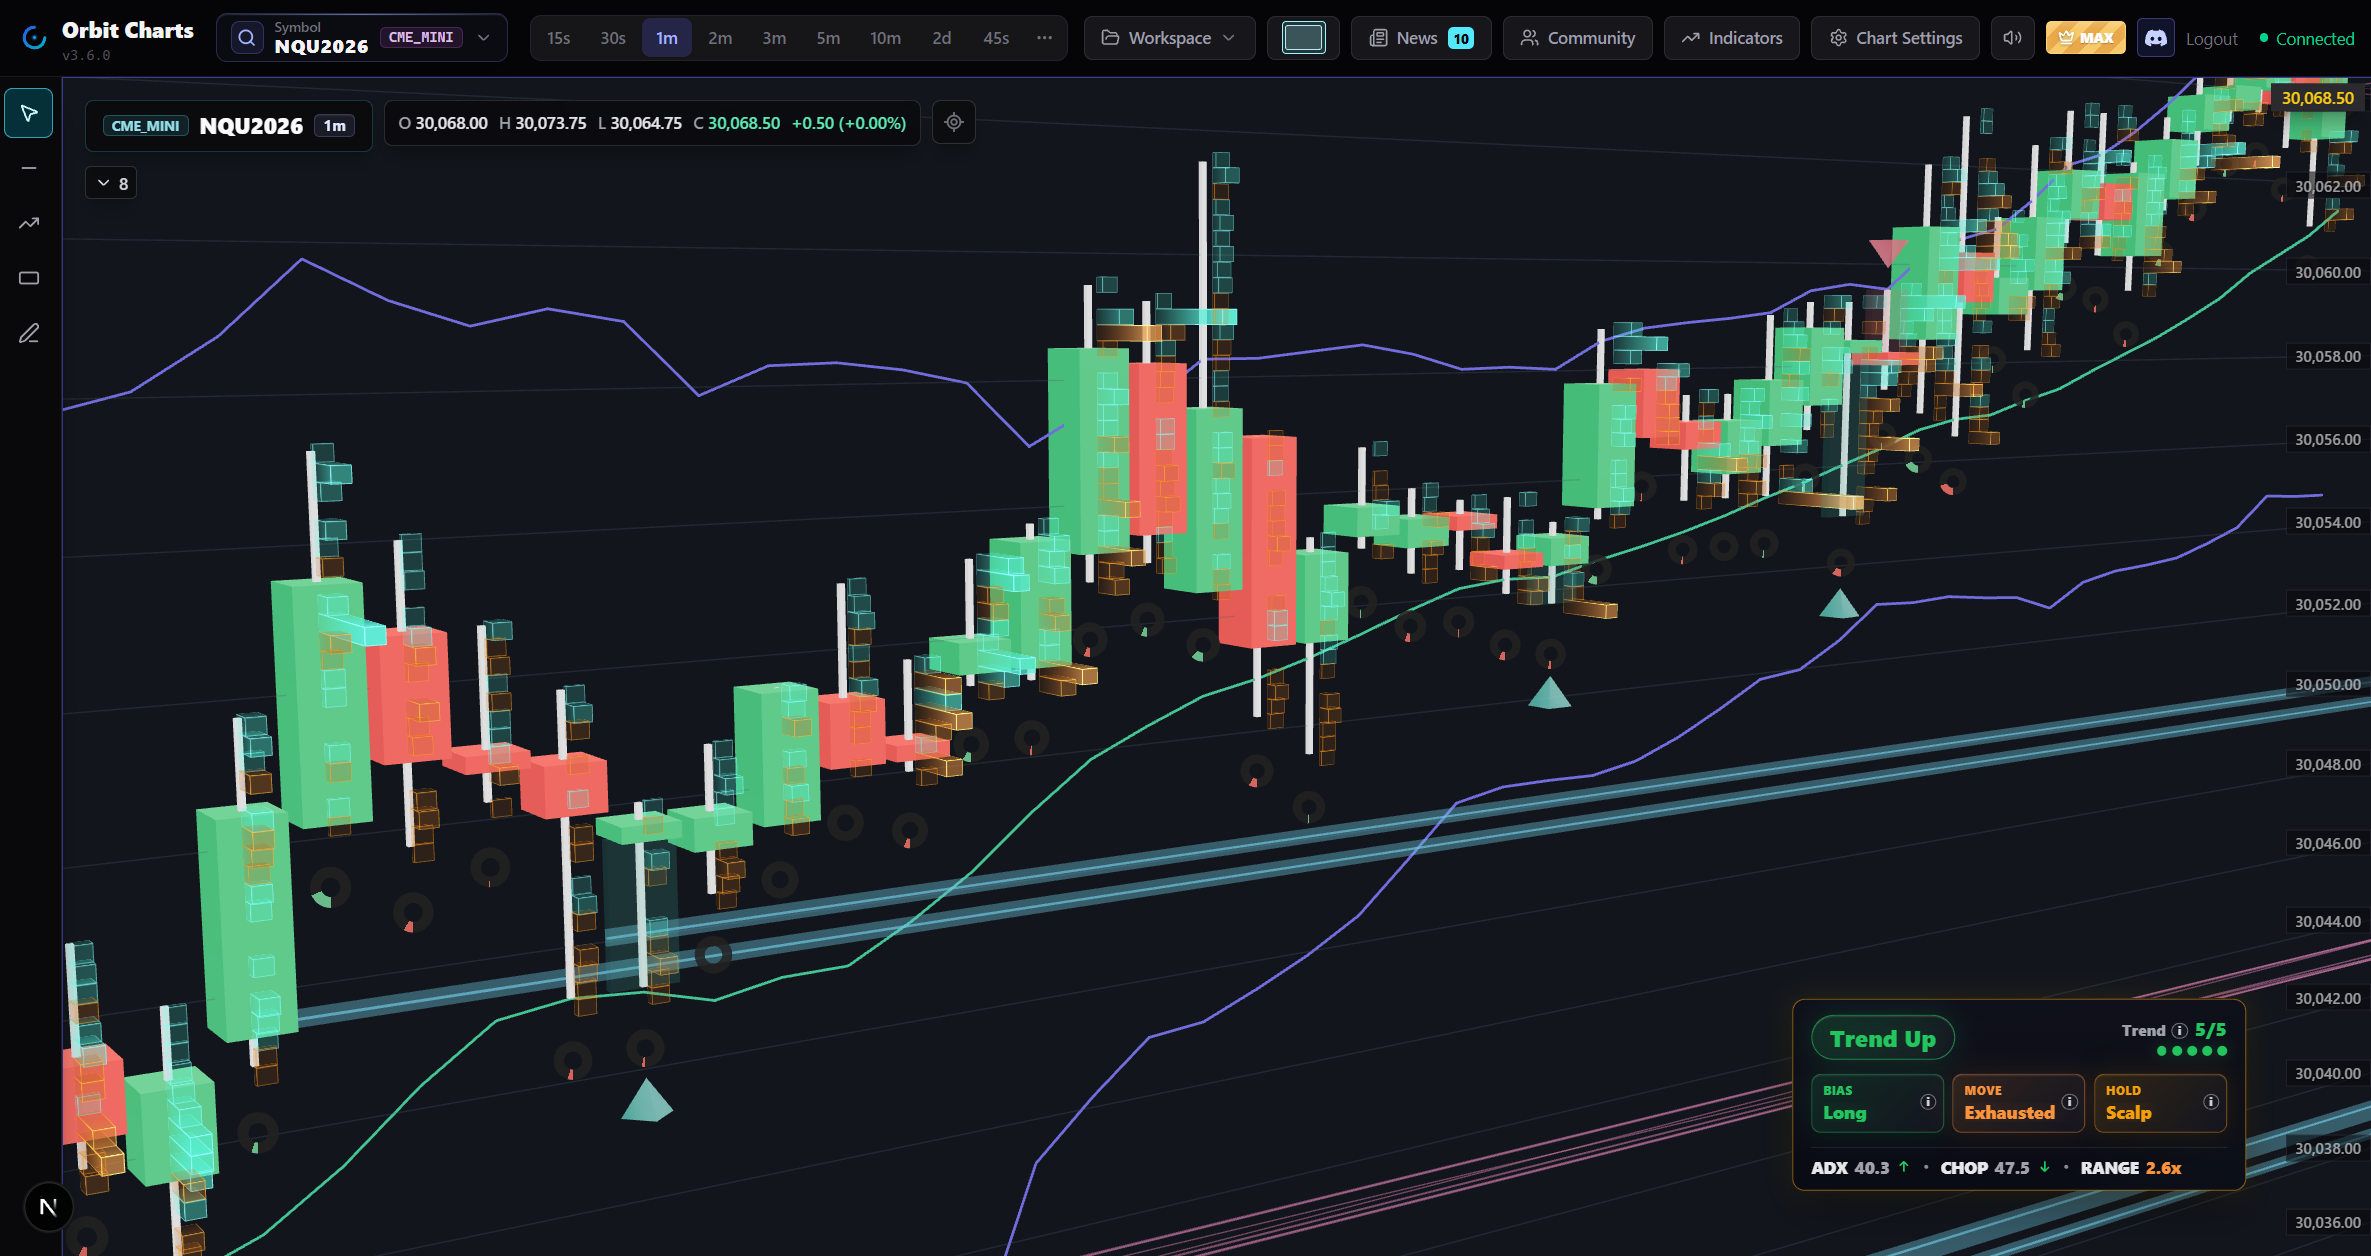
Read Order Flow Through Visual Shape
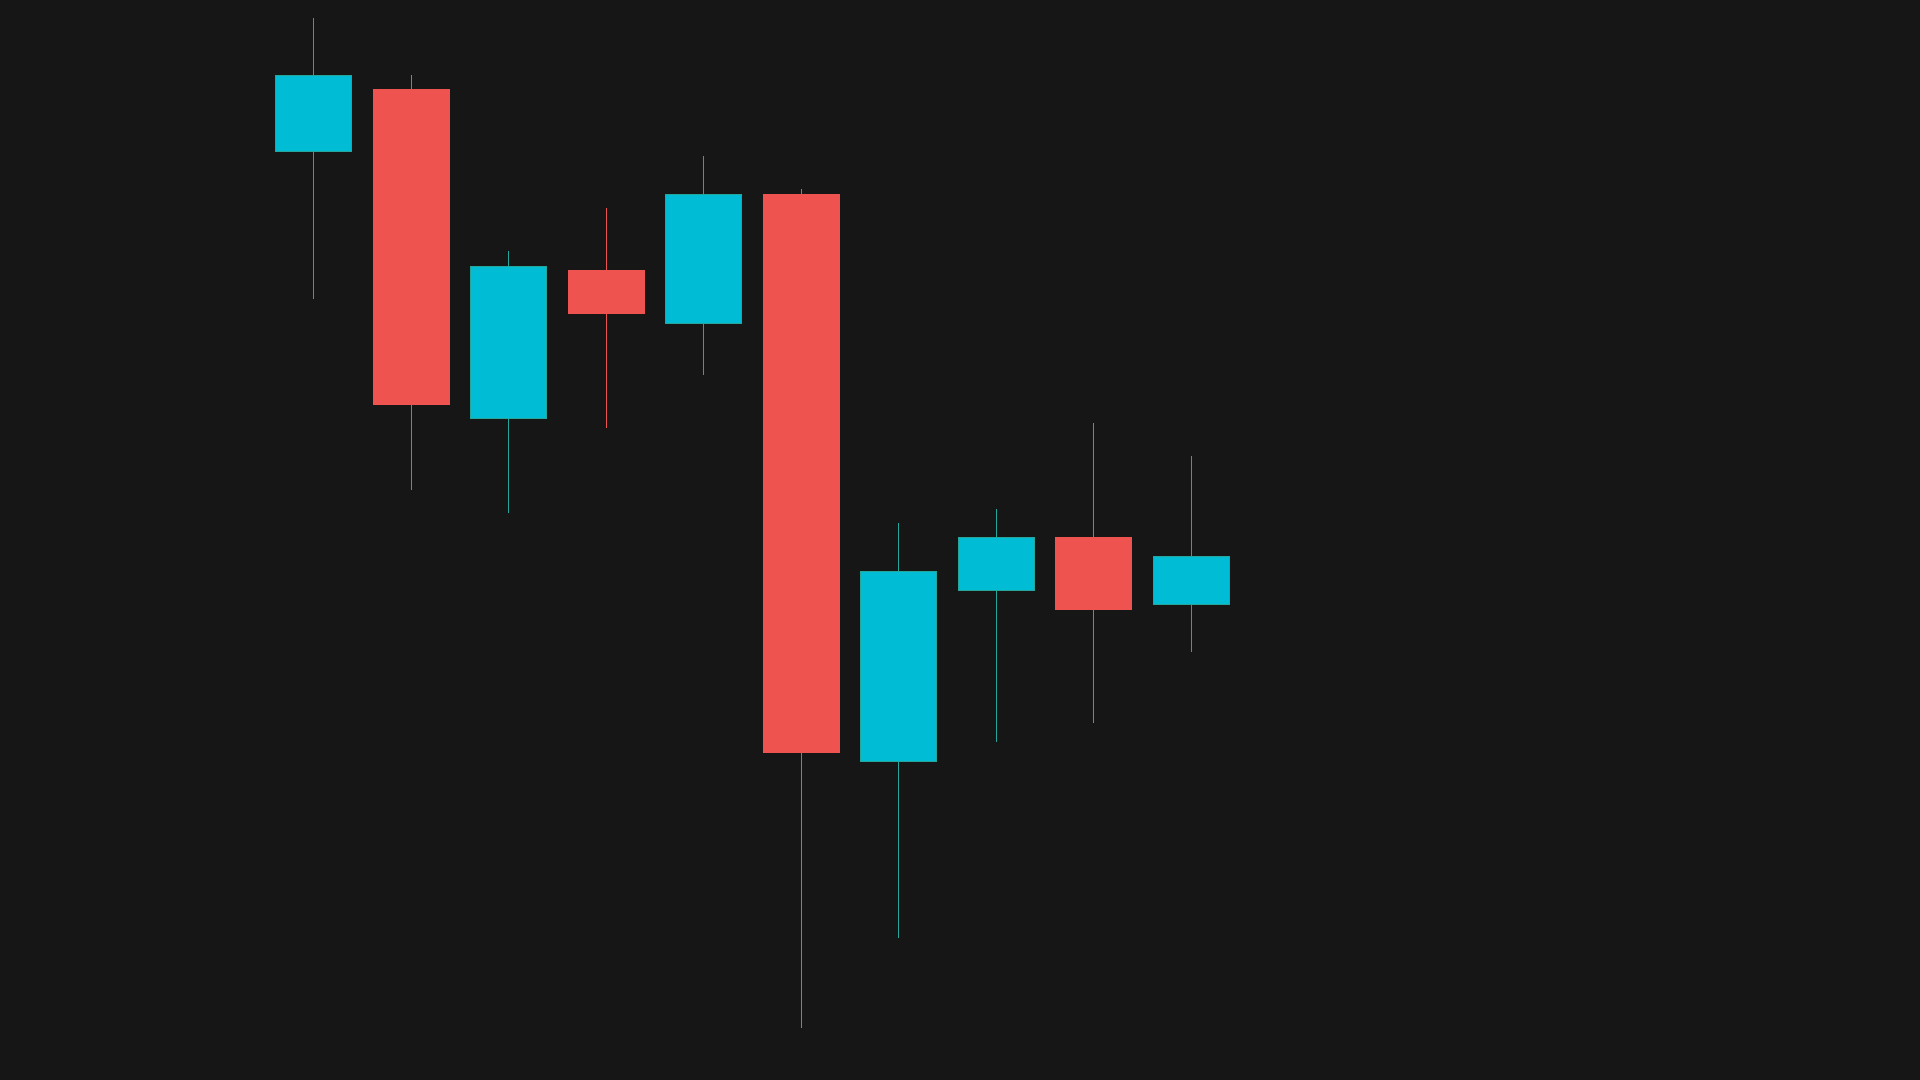
Traditional charts can make order-flow context hard to scan
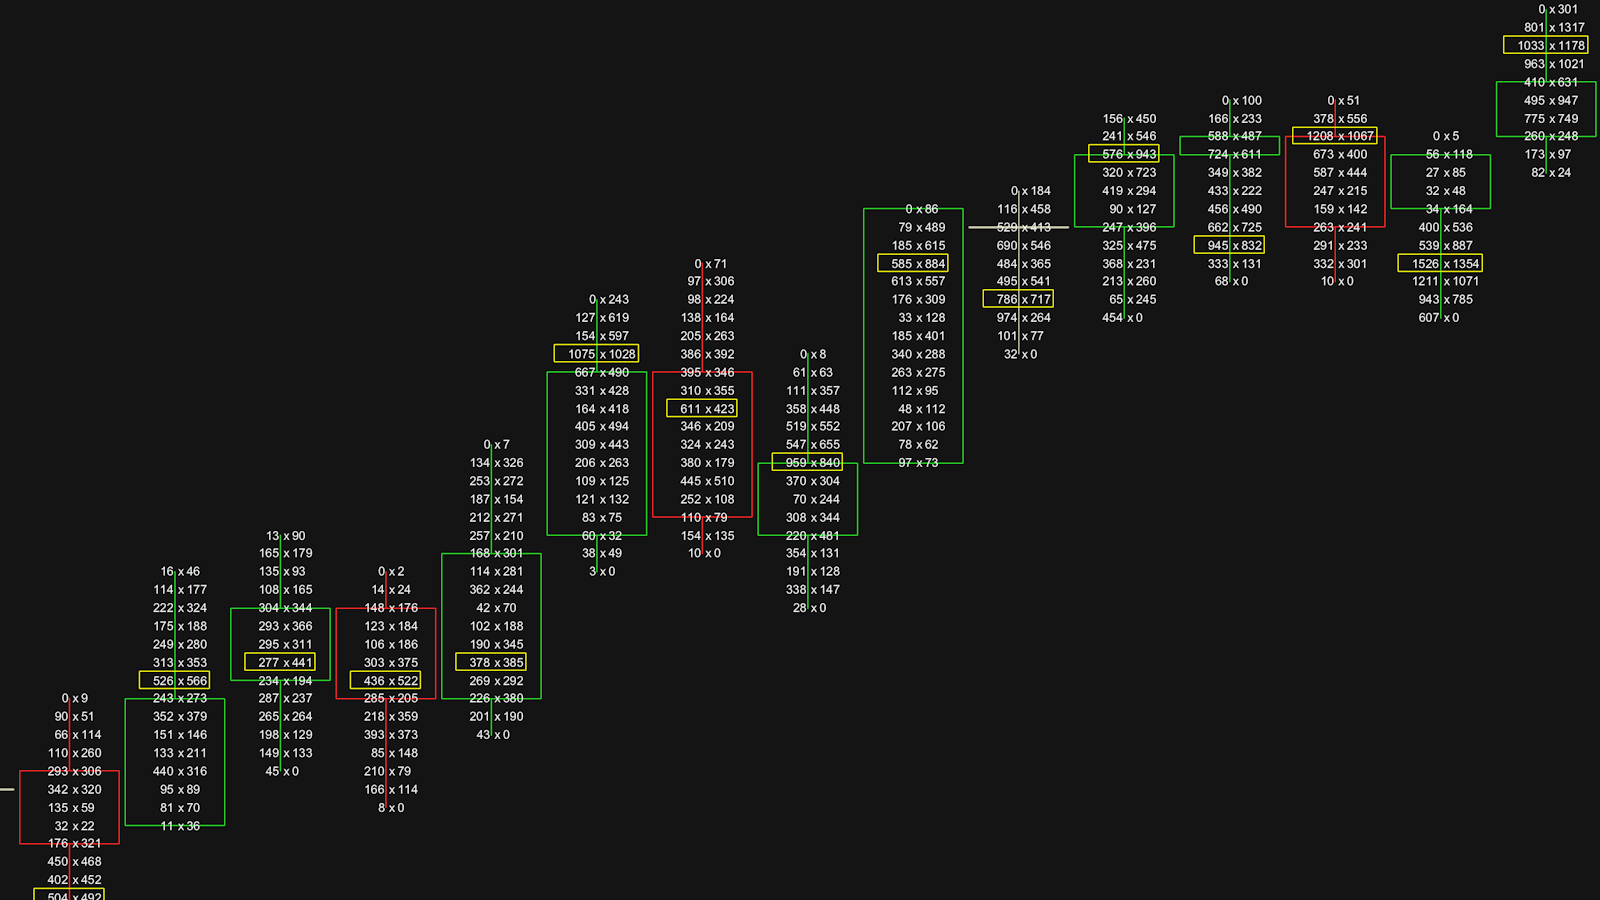
Order-flow data is powerful, but number-heavy
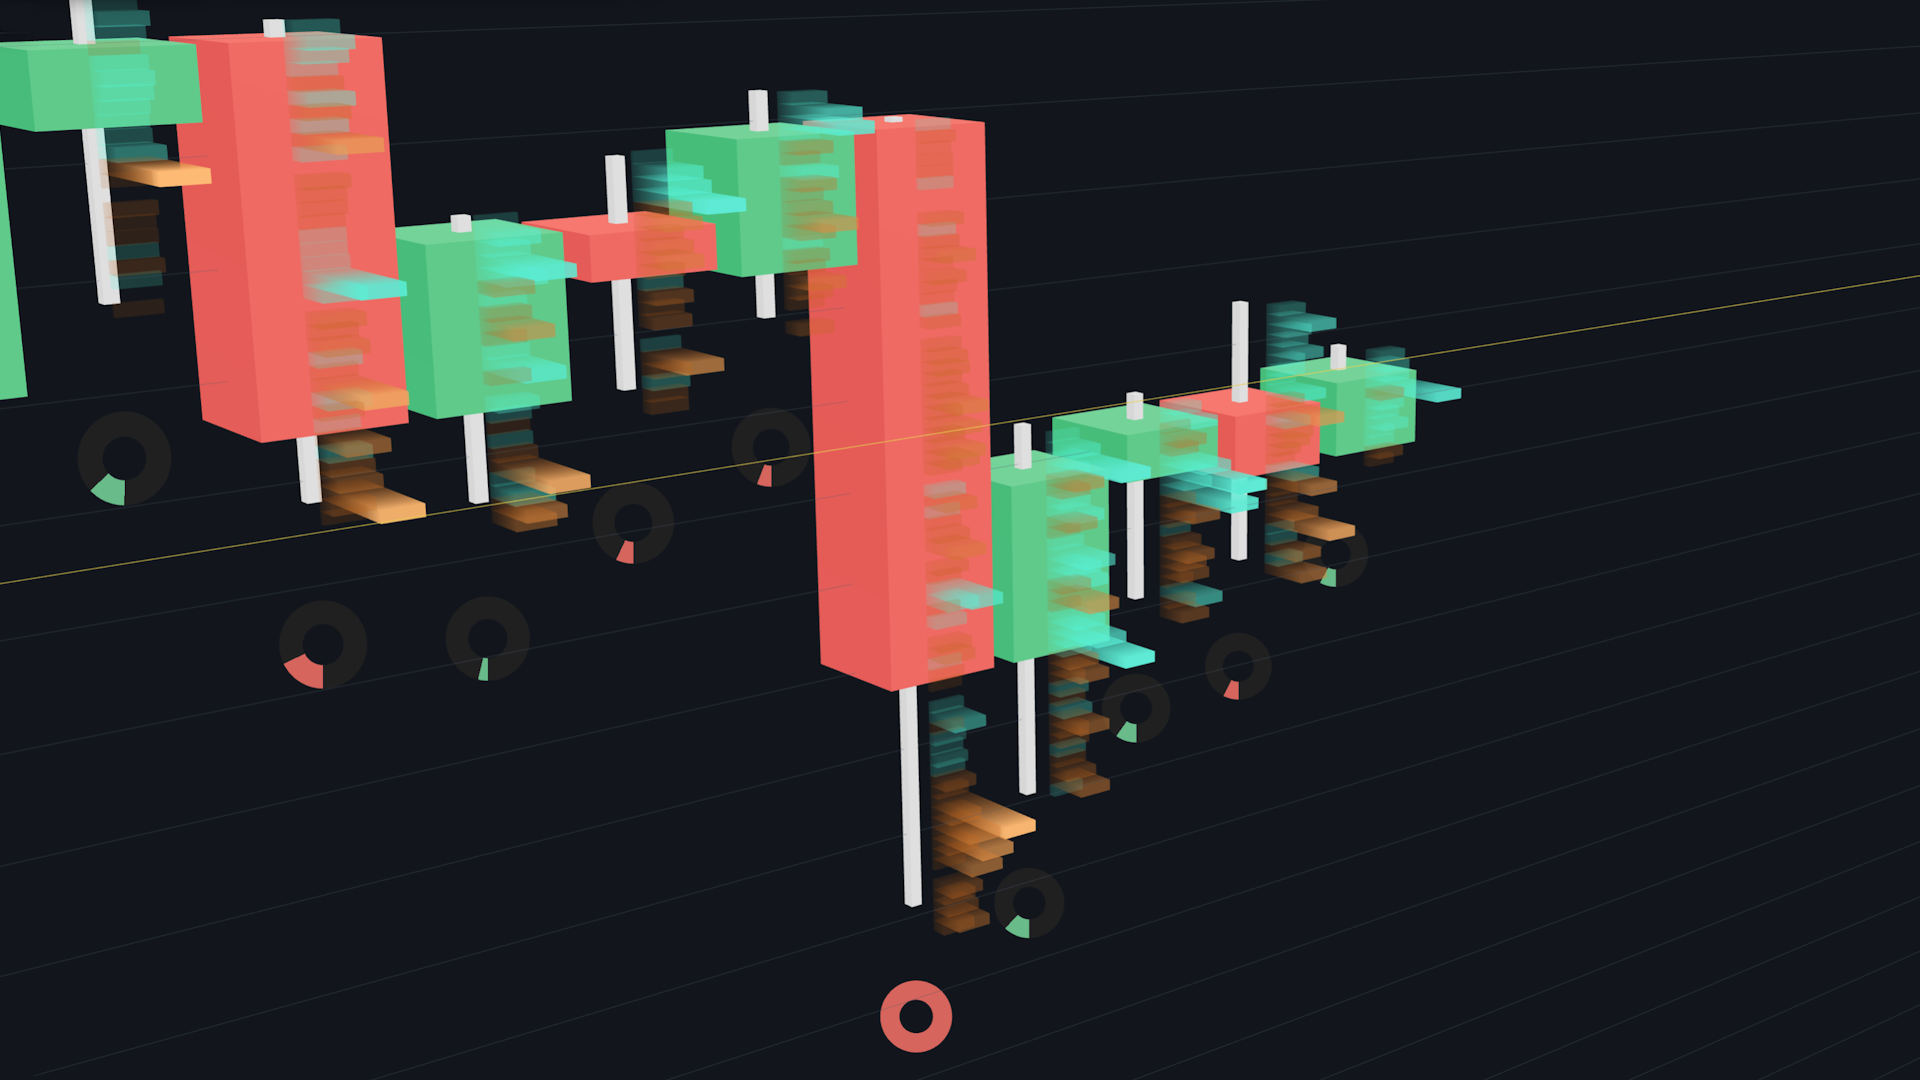
Orbit Charts turns order-flow into visual shape
Orbit Charts uses depth, motion, and spatial feedback to make absorption, pressure shifts, and live volume shape easier to see, easier to understand, and faster to interpret.
Market Data As Shape, Not A Wall Of Numbers
Orbit Charts grew out of the need for faster visual reads during real prop firm trading. The workflow is built around practical questions traders face every session, without turning the product into a signal service or execution platform.
Is this market clean or choppy?
Is pressure building, fading, or being absorbed?
Is this move extended enough that chasing is dangerous?
Where is volume concentrating around the current price action?
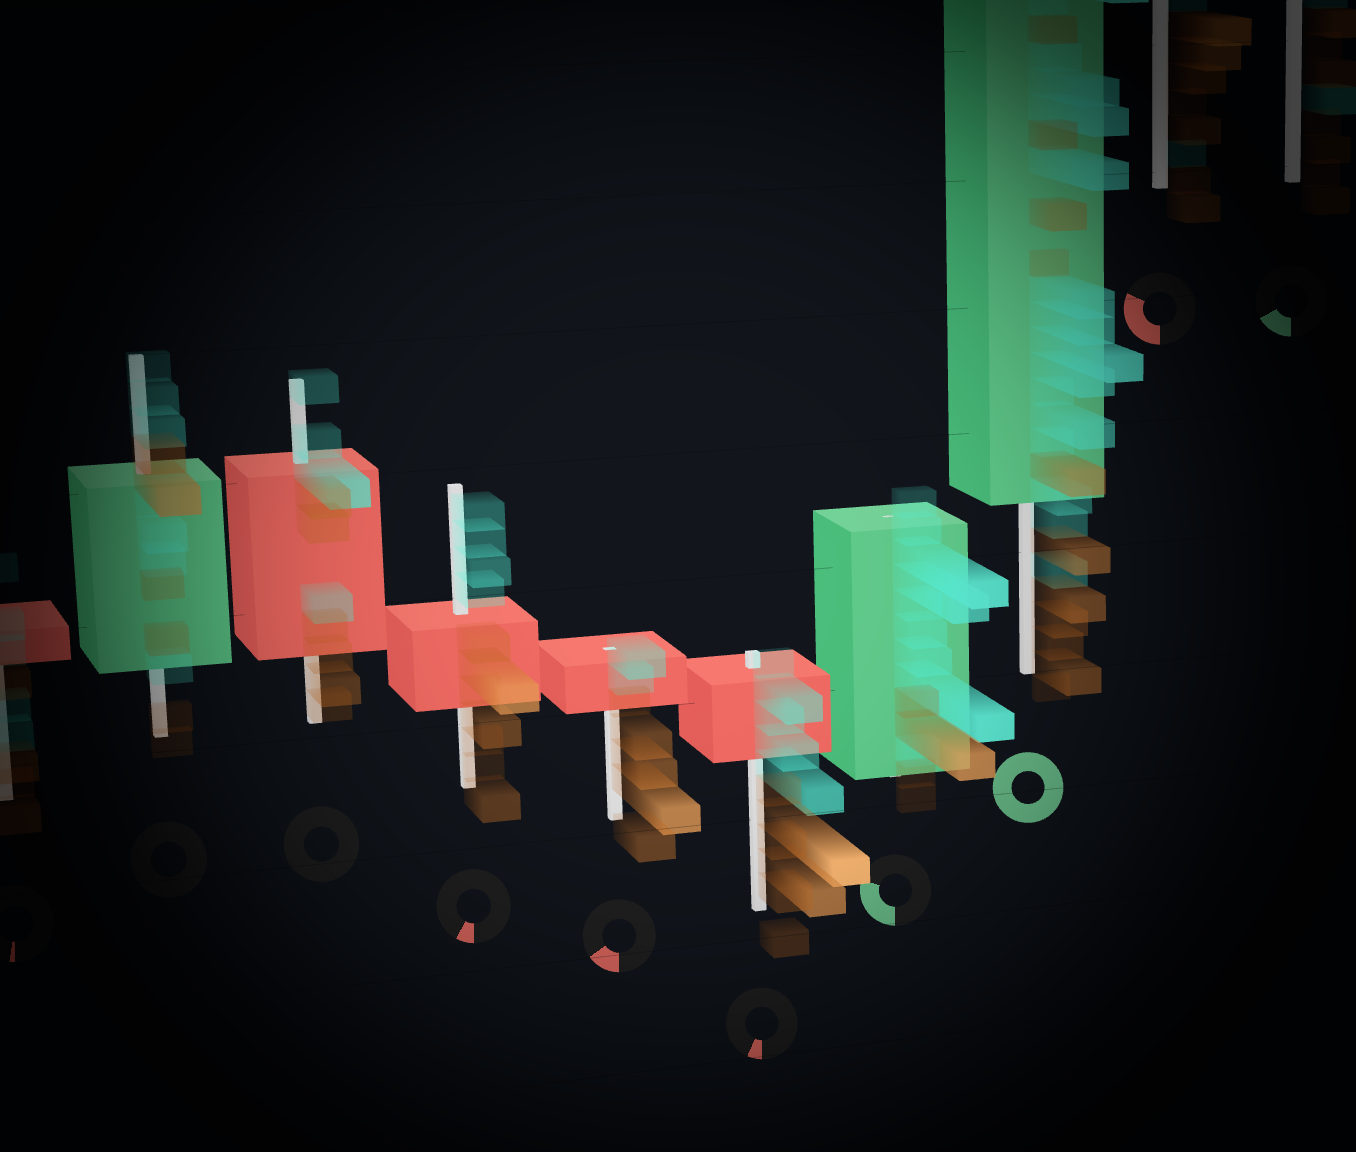
Heatmap pressure
See where activity is clustering around price instead of scanning a separate panel.
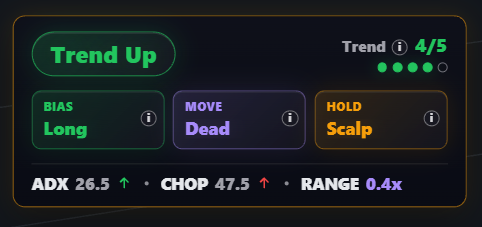
Regime context
Keep chop, trend, range, and trade-management context near the chart.
Where Orbit Charts Fits In Your Prop Firm Workflow
Orbit Charts is analysis-only software for before-trade and during-trade market context. You read pressure and shape here, then place and manage orders in your broker or prop firm trading platform.
Before the trade
Check regime, chop or trend, volatility, and pressure zones before deciding whether a setup is clean enough to matter.
During the setup
Watch heatmap pressure, wick absorption, volume ticks, and sentiment confirmation while the move is developing.
Execution stays separate
Orbit Charts is market analysis only. Place and manage orders in your broker or prop firm trading platform.
Prop firm discipline
Use visual context to support patience, cleaner setups, and rule-following instead of chasing every candle.
Market data included ... yes really!
Paid plans include real-time exchange market data with rapid tick-based updates over WebSockets. No separate feed subscription, exchange fee setup, API keys, or vendor account required.
Coverage and availability may vary by market/instrument.