Market Data Included Trading Charts
Orbit Charts gives traders browser-based 3D trading charts with real-time exchange market data included on paid plans, so you can spend less time configuring feeds and more time reading market structure.
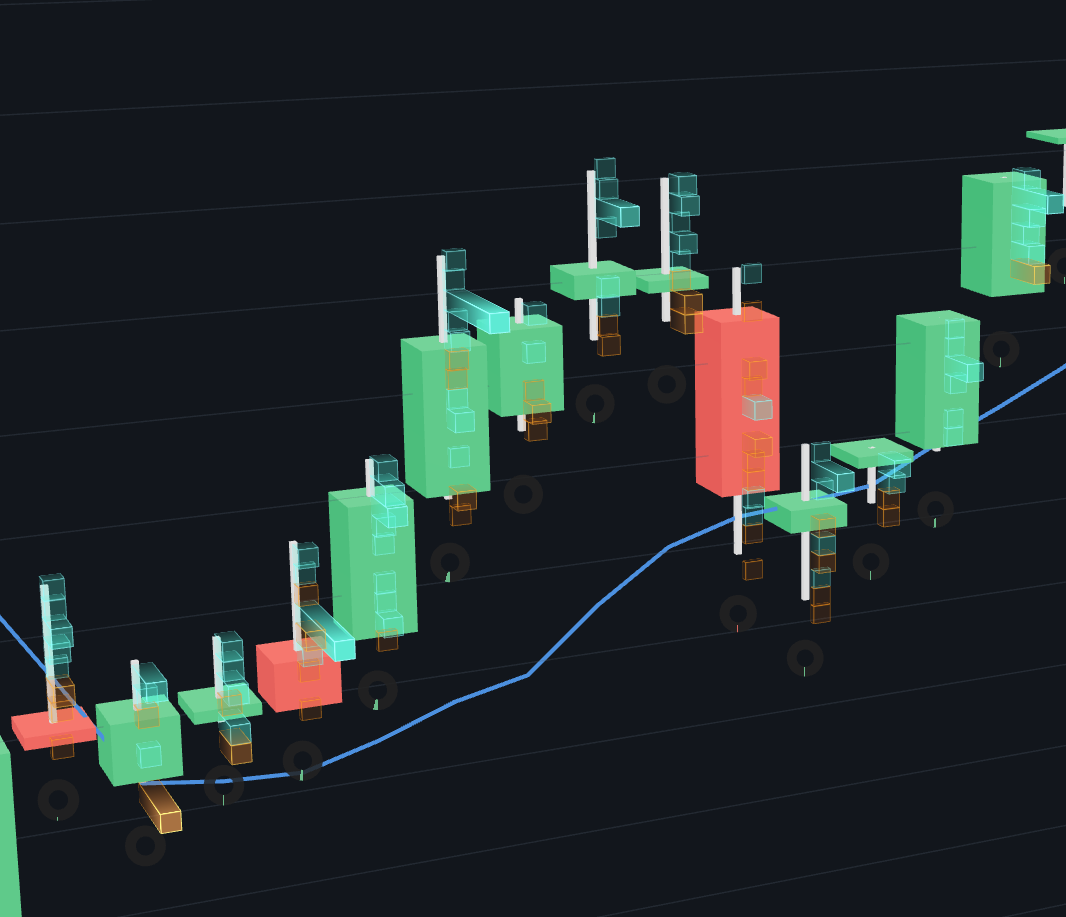
Trading Charts Without A Separate Market Data Setup
Orbit Charts packages the charting workspace and real-time exchange market data together on paid plans, which is especially useful for short-term and prop firm traders who want less setup before analysis.
Market data included
Paid Orbit Charts plans include real-time exchange market data, reducing the setup work before you can analyze a chart.
Browser-based charts
Launch the web app from a modern desktop browser instead of starting with an installer or local charting workstation.
Tick-based updates
Use rapid market updates alongside 3D charting, heatmaps, volume visuals, and context indicators.
Analysis first
Orbit Charts is not a broker or order-entry tool. It is built for visual market analysis before and during decision-making.
Market data included, without the usual setup spiral
Paid plans include real-time exchange market data with rapid tick-based updates over WebSockets. No separate feed subscription, exchange fee setup, API keys, or vendor account required.
Real-time exchange data
Paid plans include real-time exchange market data with rapid tick-based updates over WebSockets.
No separate feed setup
No separate feed subscription, exchange fee setup, API keys, or vendor account required.
Simple included access
Start with the charting workflow instead of wiring together data providers before you can analyze.
Coverage and availability may vary by market/instrument.
Less Feed Setup, More Visual Analysis
Market data included does not make Orbit Charts an execution platform. It means the analysis workflow can start faster because the data-feed decision is not a separate first step.
Built For Fast Market Reads
Prop firm and short-term traders often need quick context before a setup matters. Orbit Charts focuses on browser-based visual analysis with tools like 3D market structure, heatmaps, wick absorption, volume visuals, and market context indicators.
Open the free live NQ demo without an account.
Use paid plans when you want included real-time exchange market data access.
Analyze market pressure visually; place trades elsewhere.
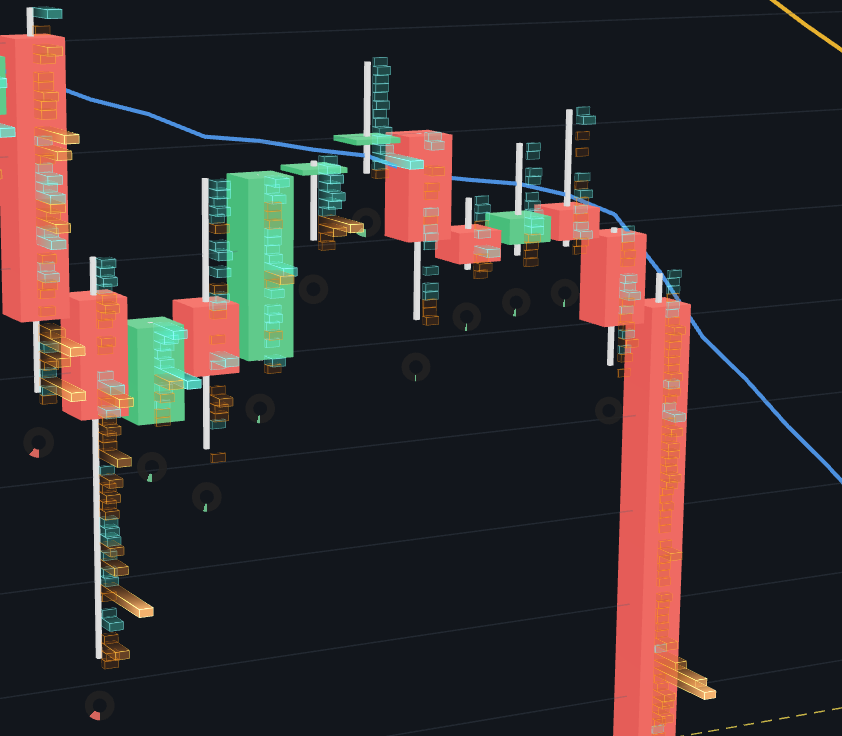
Multiple market types
Orbit Charts describes support for real-time data across stocks, ETFs, crypto, forex, and futures.
3D visual workspace
Use depth, motion, and camera control to inspect market pressure in a spatial charting environment.
Context indicators
Add familiar context tools like RSI, ADX, ATR, regime, sentiment, wick absorption, and volume visuals.
Common Questions About Market Data Included
Does Orbit Charts include market data?
Yes. Orbit Charts paid plans include real-time exchange market data with rapid tick-based updates over WebSockets. Traders do not need to buy a separate feed subscription, complete exchange fee setup, copy API keys, or create a vendor account before using the browser app.
What markets does Orbit Charts mention for market data access?
Orbit Charts describes support for real-time market data across stocks, ETFs, crypto, forex, and futures, with the live NQ demo available for a fast product trial. Coverage and availability may vary by market or instrument.
Can I use Orbit Charts without installing desktop charting software?
Yes. Orbit Charts runs in a modern desktop browser. The live NQ demo opens without a credit card, account, or download.
Is Orbit Charts for trade execution?
No. Orbit Charts is market analysis software. It helps traders inspect 3D market structure, volume pressure, and context, but it does not place trades and does not replace a broker.
Why do prop firm traders care about market data included?
Market data included reduces setup friction for prop firm and short-term traders who want to evaluate market structure quickly without comparing feed vendors first.