Prop Firm Trading Chart Software
Orbit Charts gives prop firm and short-term traders a browser-based 3D market analysis workspace for reading pressure, heatmaps, live volume, and context before placing trades elsewhere — on any account type, evaluation or funded.
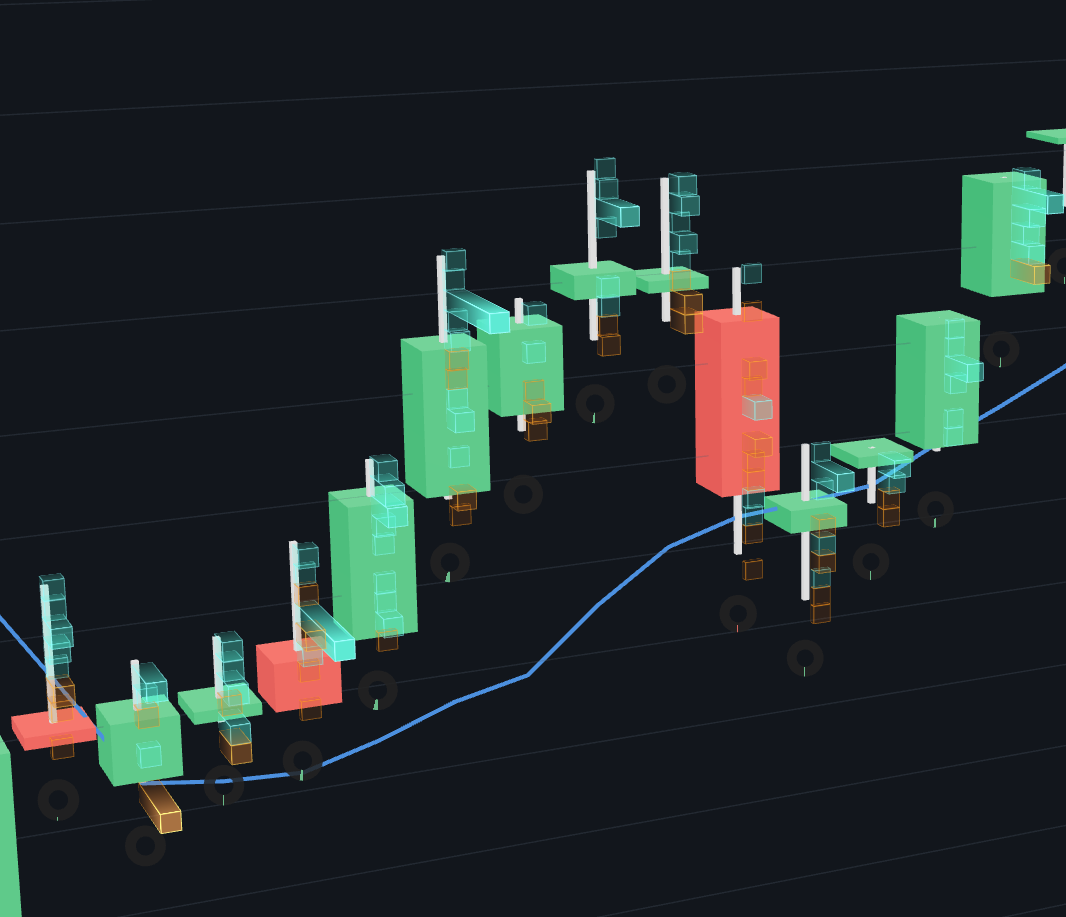
Market Analysis For Prop Firm Traders
Orbit Charts is built for traders who want fast visual context, not another order-entry screen. The workflow is chart-first, browser-based, and focused on market structure.
Fast visual reads
Prop firm traders often need to decide quickly whether market context is clean enough to matter.
Pressure and context
Use 3D market structure, heatmaps, wick absorption, sentiment, volume visuals, and regime context together.
Market data included
Paid Orbit Charts plans include real-time exchange market data, so there is no second feed bill on top of evaluation and account fees.
Analysis, not execution
Orbit Charts helps traders analyze market context. It does not place trades or replace a broker.
Where Orbit Charts Fits In Your Prop Firm Workflow
A prop firm workflow separates analysis, rules, execution, and review. Orbit Charts sits in the analysis layer before and during a setup, while order placement stays in your broker or prop firm trading platform.
Works Alongside Any Prop Firm's Platform
Because Orbit Charts is browser-based and never touches your account, the workflow is the same no matter which firm funds you.
Trading a Topstep account?
Topstep traders execute in the platforms Topstep supports. Orbit Charts runs in a separate browser tab as the market-context layer — regime, pressure, and heatmap reads — while orders stay in the firm's platform.
Trading a Apex Trader Funding account?
Apex traders keep execution in their firm-provided platform. Orbit Charts sits alongside it as an independent visual read of volume concentration, absorption, and market regime.
Trading a MyFundedFutures account?
MyFundedFutures traders use whichever execution platform their plan provides. Orbit Charts adds 3D market structure and order-flow context in the browser without touching your account.
Trading a Tradeify account?
Tradeify traders can keep their evaluation or funded account workflow unchanged and use Orbit Charts as a pre-trade and during-trade context screen for pressure and chop-versus-trend reads.
Trading a TakeProfitTrader account?
TakeProfitTrader traders execute where their firm requires. Orbit Charts provides the visual analysis layer — heatmap, sentiment, and volume ticks — next to that platform.
Not affiliated: Orbit Charts is not affiliated with, endorsed by, or partnered with Topstep, Apex Trader Funding, MyFundedFutures, Tradeify, TakeProfitTrader, or any proprietary trading firm. Firm names are used only to describe how independent analysis software fits alongside their platforms. Always follow your firm's current rules.
Context That Supports Rule-Following
Prop firm accounts — evaluation or funded — are largely about discipline: following your firm's rules and avoiding low-quality conditions. Orbit Charts' regime and chop context, pressure zones, and absorption reads exist to answer one question before you commit — is this market clean enough to matter right now?
Check regime and chop-versus-trend context before the session heats up.
Watch whether pressure is building, fading, or being absorbed during a setup.
Use the visual read to support patience instead of chasing every candle.
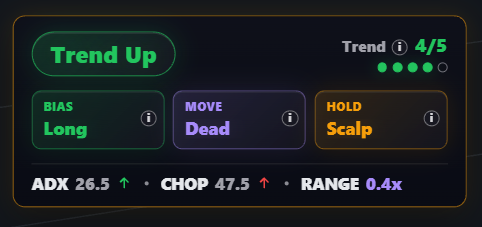
Practical Questions, Faster Visual Answers
Orbit Charts was built out of the need for faster visual market reads during real prop firm trading. It is not a signal service and it does not promise outcomes; it is a visual analysis workspace for understanding context before and during trades.
Is the market clean or choppy?
Is pressure building, fading, or being absorbed?
Is this move already extended?
Where is volume concentrating around price?
Read Pressure Before The Setup Gets Old
Use 3D charting, the 3D Trade Heatmap, wick absorption, sentiment, volume tick visuals, and market regime context to inspect whether a market is clean, extended, rejecting, or building pressure.
Launch the live NQ demo in the browser before subscribing.
Use paid plans when you need included real-time exchange market data access.
Keep execution, broker rules, and prop firm rules outside Orbit Charts.
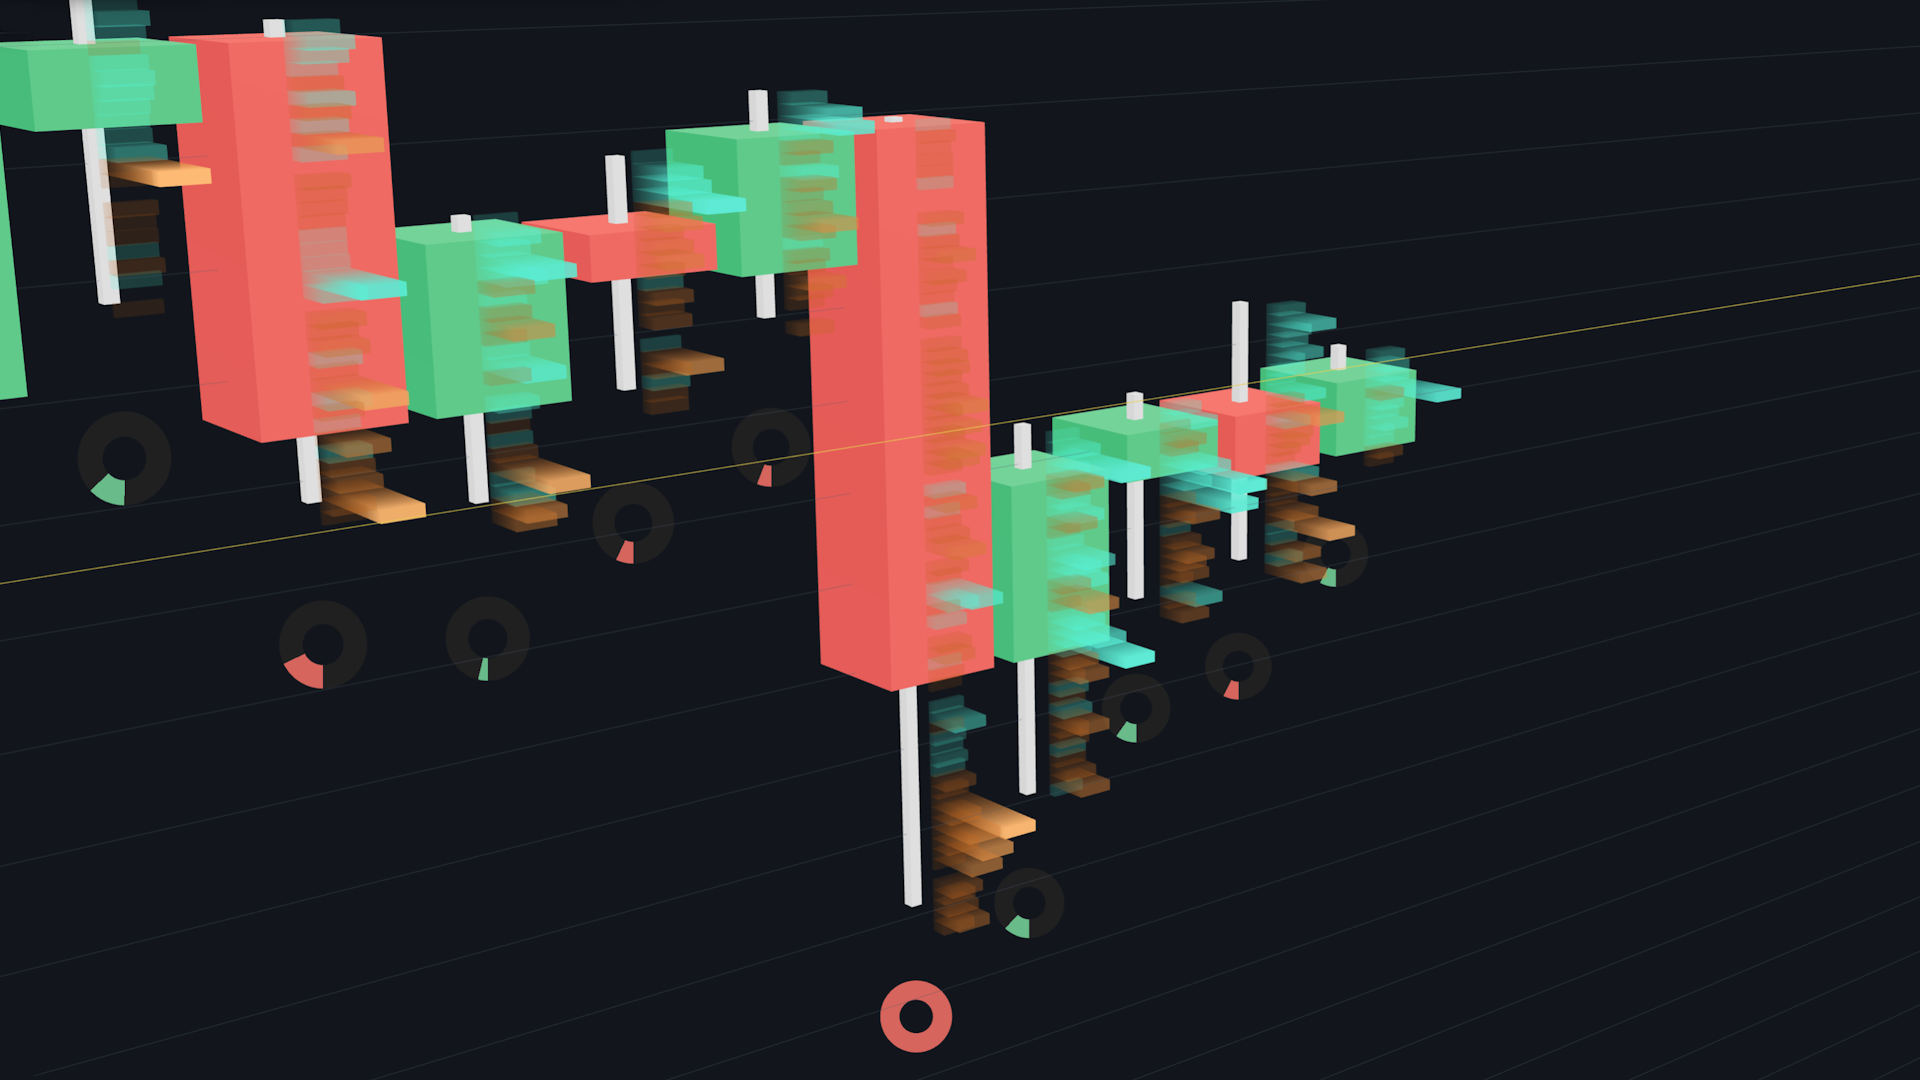
Browser-based demo
Try the live NQ demo in a modern desktop browser without a download, credit card, or account.
Market data included
Paid plans include real-time exchange market data access, reducing setup friction before analysis.
3D market context
Use depth, motion, and spatial feedback to inspect market structure faster than dense flat panels alone.
Common Questions For Prop Firm Traders
Is Orbit Charts useful for prop firm traders?
Orbit Charts is designed for short-term and prop firm traders who need fast visual reads of market structure, pressure zones, heatmaps, volume context, and live market movement.
Can prop firm traders place trades in Orbit Charts?
No. Orbit Charts is market analysis software, not a broker or trade execution platform. It is not built for order routing. Traders use it to inspect market pressure and context, then place and manage trades in their broker or prop firm trading platform.
Does Orbit Charts include market data for prop firm trading workflows?
Yes. Paid Orbit Charts plans include real-time exchange market data with rapid tick-based updates over WebSockets, reducing feed setup work before chart analysis.
Can I try Orbit Charts before subscribing?
Yes. Orbit Charts provides a free live NQ demo in the browser without an account, credit card, or download.
Which prop firms does Orbit Charts work with?
Any of them. Orbit Charts runs in a browser tab next to whichever execution platform your firm supports — evaluation or funded account — acting as an independent market analysis layer while orders stay in your firm's platform.
Does Orbit Charts connect to my prop firm account?
No. Orbit Charts never touches your account, your orders, or your firm's platform. It is a separate browser-based analysis workspace with its own included market data.
Is Orbit Charts affiliated with Topstep, Apex, or other prop firms?
No. Orbit Charts is independent market analysis software and is not affiliated with, endorsed by, or partnered with any proprietary trading firm.
Will Orbit Charts help me pass an evaluation?
No tool can promise evaluation outcomes, and Orbit Charts does not. What it provides is market context — regime, pressure, volume, and absorption reads — that supports disciplined, rules-based decisions.