Orbit Charts vs Bookmap
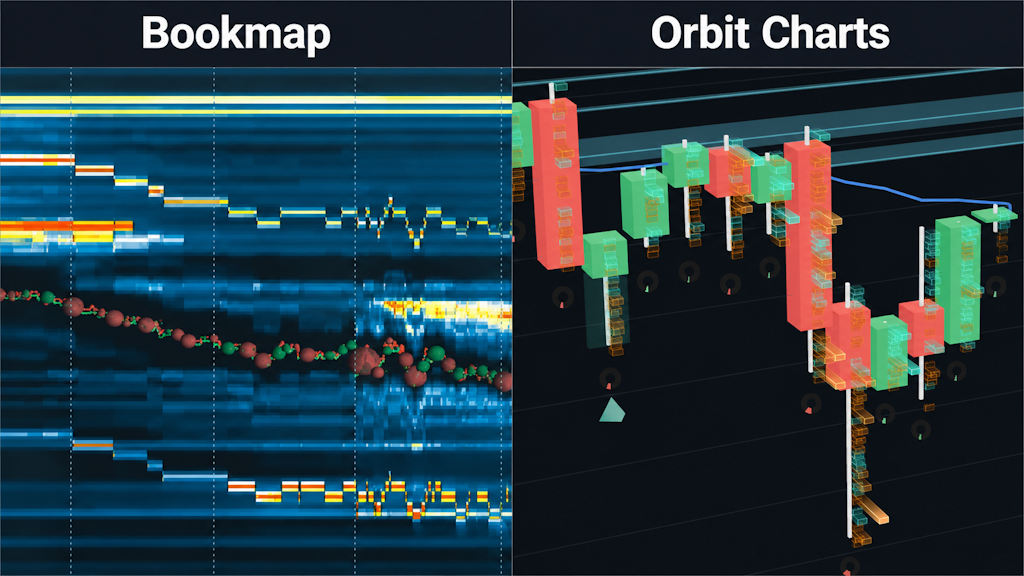
Both tools help traders read order flow — though they take different approaches. Bookmap is a desktop heatmap platform; Orbit Charts renders order flow as 3D shape in your browser with market data included. The right pick depends on your workflow.
Which One Fits Your Workflow?
Neither tool is a strict replacement for the other. Here is the honest short version.
Choose Orbit Charts if…
You want browser-based analysis with no install, order flow rendered as 3D spatial shape instead of dense 2D panels, real-time market data included in the plan price, and a lower-cost analysis layer that runs alongside whatever execution platform you already use.
Choose Bookmap if…
You want a desktop order-flow and DOM heatmap platform with broker and execution integrations, many configuration options, and you prefer analysis and order entry in one place.
Orbit Charts And Bookmap Compared
Bookmap is a product of its respective owner. Orbit Charts is not affiliated with Bookmap. Third-party product details change over time — verify current features, pricing, and trial options on their site.
What 3D Changes About The Read
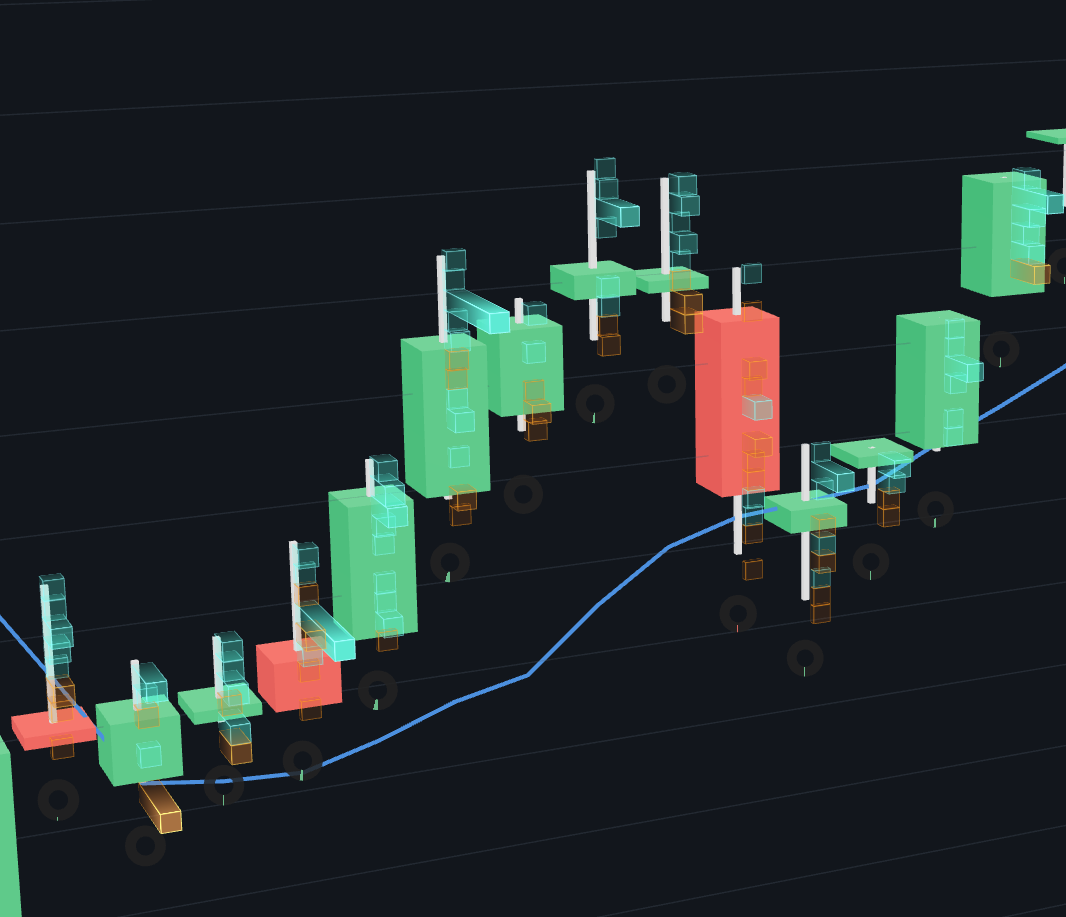
Traditional heatmaps and footprint tools present order flow as dense 2D panels — powerful, but number-heavy under time pressure. Orbit Charts renders the same kind of activity as depth, motion, and spatial structure, so concentration, absorption, and pressure shifts can be scanned as shape instead of decoded cell by cell.
See where volume concentrates around price as visible structure.
Rotate and inspect the same market from more than one angle.
Keep regime, sentiment, and absorption context near the price action.
They can run side by side
Because Orbit Charts is a browser tab, trying it does not mean replacing anything. Many traders keep their existing execution or order-flow setup and add Orbit Charts as a visual context layer.
The fastest comparison is live
The free live NQ demo opens in seconds with real-time data. Watch one session in both tools and judge which read is faster for you.
Common Questions About Orbit Charts And Bookmap
Is Orbit Charts a Bookmap alternative?
For visual order-flow analysis, yes — Orbit Charts is a browser-based alternative that renders trade activity, pressure, and volume as 3D shape. It does not replace Bookmap's execution integrations, because Orbit Charts is analysis-only by design.
Can I place trades in Orbit Charts like I can through Bookmap integrations?
No. Orbit Charts is market analysis software and never routes orders. Traders read pressure and context in Orbit Charts, then place and manage orders in their broker or prop firm trading platform.
Do I need a separate market data feed with Orbit Charts?
No. Paid Orbit Charts plans include real-time exchange market data with rapid tick-based updates over WebSockets, so there is no separate feed subscription, exchange fee setup, or vendor account to configure.
Can I run Orbit Charts alongside Bookmap or my execution platform?
Yes. Orbit Charts runs in a modern desktop browser tab, so it works next to any desktop software you already use — including Bookmap, your broker platform, or your prop firm's platform.
How can I compare them myself?
Open the free live NQ demo of Orbit Charts in your browser — no account, credit card, or download — and put it side by side with your current order-flow setup during a live session.