3D Financial Market Visualization Software
Orbit Charts is browser-based 3D financial market visualization software for traders who want to read price action, order-flow pressure, live volume, and market context as visible spatial structure.
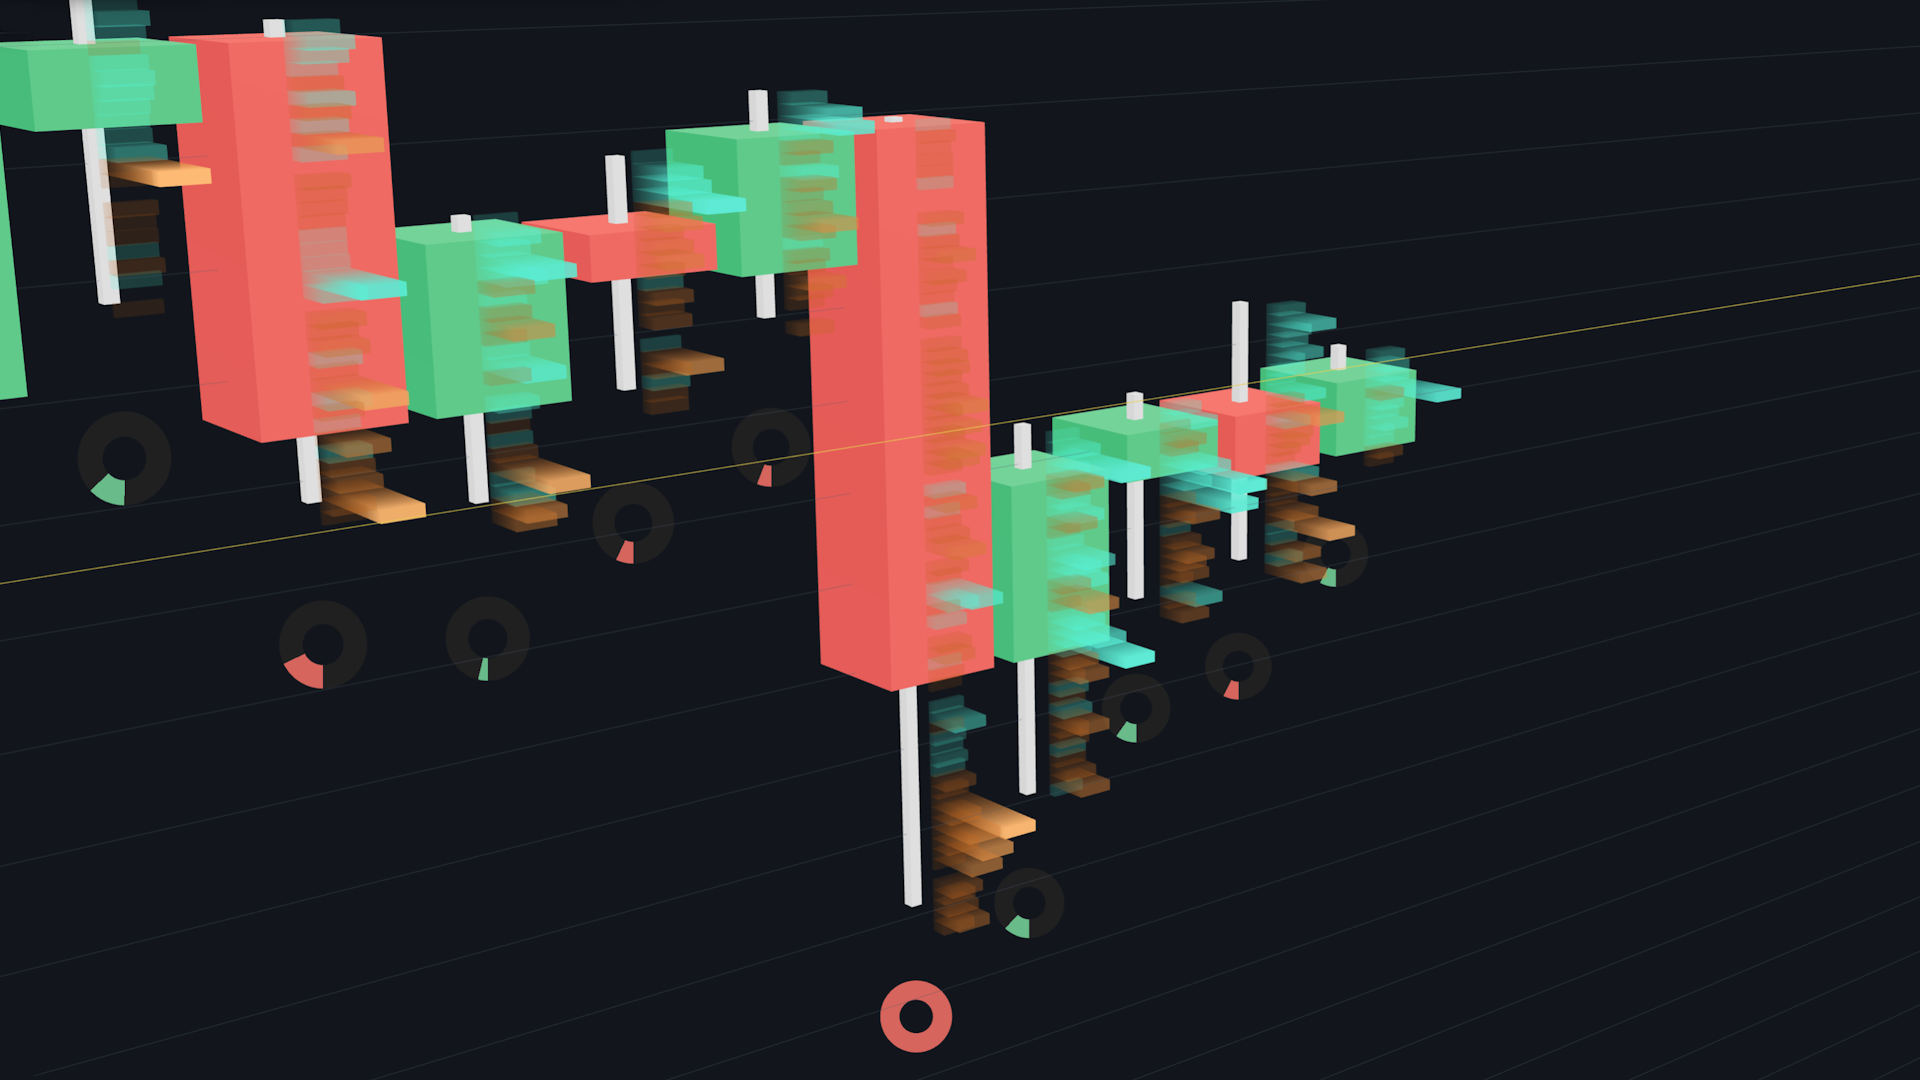
What Orbit Charts Shows In 3D
The goal is not to make charts decorative. The goal is to turn market pressure into shape, motion, and context that can be scanned faster than dense panels of numbers.
Spatial market structure
Orbit, pan, and zoom through a 3D chart so pressure zones and formations can be inspected from more than one angle.
3D trade heatmap
Cluster trade activity by price level to make high-activity zones, rejection areas, and volume pressure easier to locate.
Real-time market data
Use real-time exchange data and rapid tick-based updates directly in the browser without a separate feed subscription setup.
Answer-first signals
Read wick absorption, sentiment, regime context, volume ticks, and gauge indicators close to the price action they explain.
3D Order Flow Chart Software, Without A Separate Data Setup
Orbit Charts is designed for visual market analysis. It is not an order-entry platform; it is a browser-based workspace for understanding market structure before and during a trade decision.
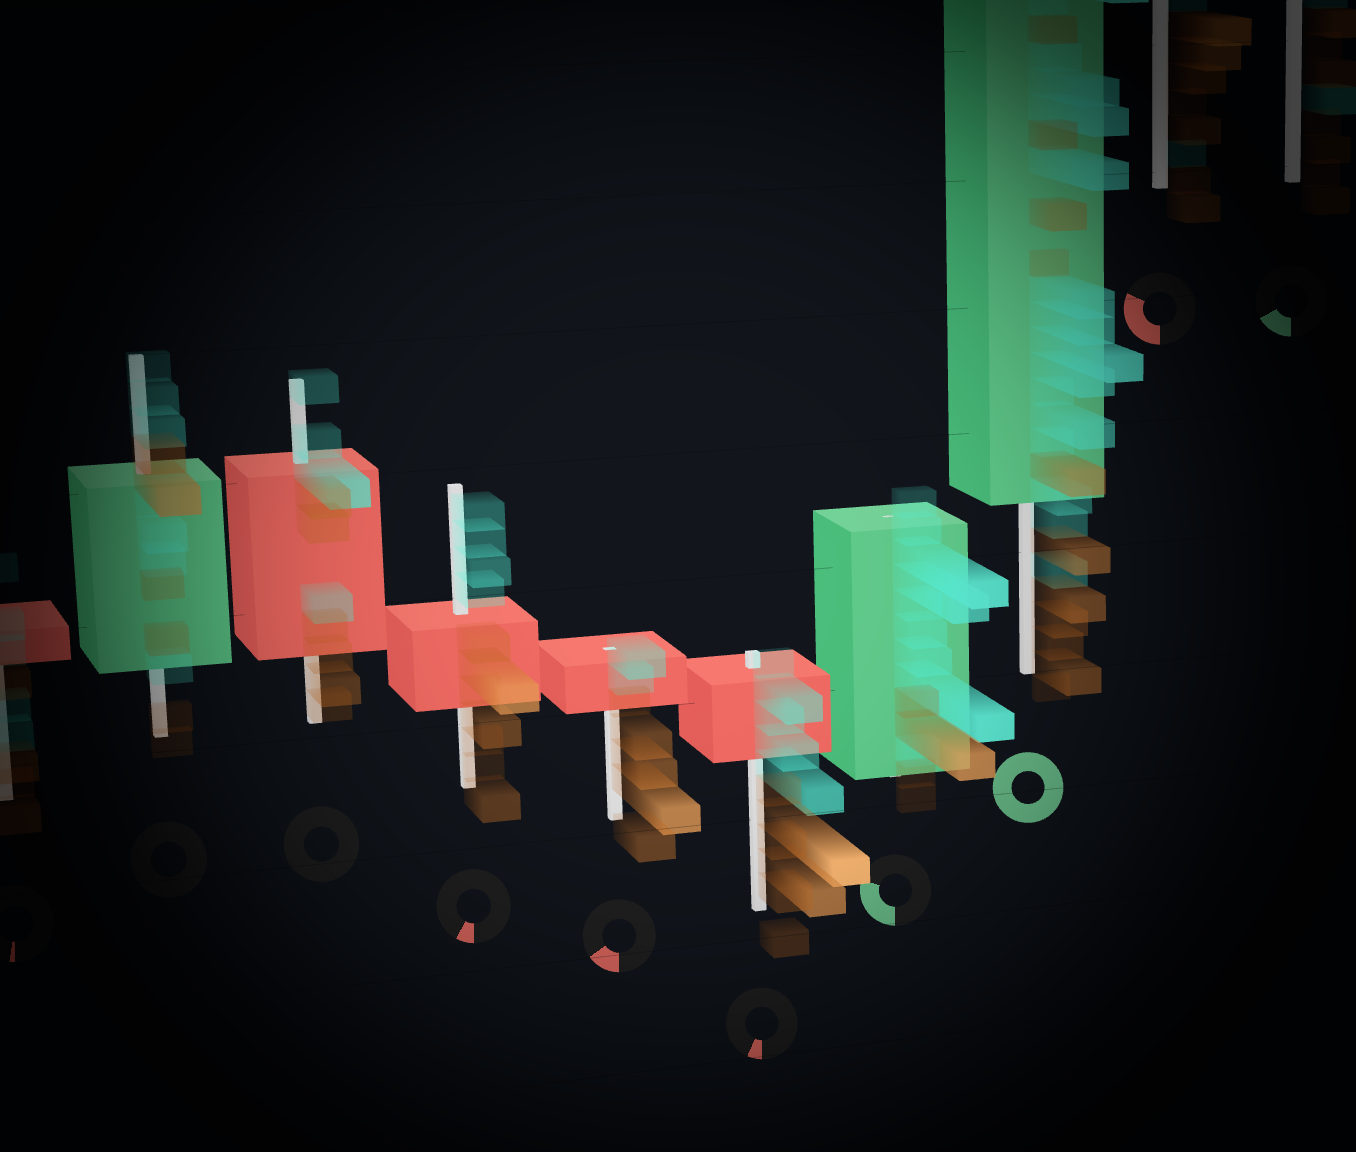
Use a 3D Trade Heatmap to inspect where activity concentrates around price levels.
Keep volume pressure, wick absorption, sentiment, and market regime context close to the chart.
Open the live NQ demo in the browser before creating an account or choosing a paid plan.
Traditional Charts vs Orbit Charts
A flat chart is still useful. Orbit Charts is built for the moments when traders want a more visual way to inspect market pressure, volume shape, and context.
Browser based
Launch Orbit Charts from a modern desktop browser. The demo does not require a download, account, or credit card.
Market data included
Paid plans include real-time exchange market data access, reducing the setup work before you can analyze a live chart.
Built for visual reads
The workflow is aimed at short-term traders who want faster visual context around price action and pressure.
Common Questions About 3D Market Visualization
What is 3D financial market visualization software?
3D financial market visualization software displays market data in a spatial charting environment so traders can inspect price action, volume pressure, heatmaps, and context from multiple angles instead of reading every signal from a flat two-dimensional chart.
What makes Orbit Charts different from a traditional trading chart?
Orbit Charts focuses on visual market analysis rather than trade execution. It turns price movement, live volume, wick behavior, and order-flow heatmap context into 3D shapes that are easier to scan quickly.
Is Orbit Charts a trading platform?
No. Orbit Charts is market analysis software. It helps traders inspect market structure and context, but it does not place trades.
Who is 3D market visualization best for?
It is most useful for short-term traders, prop firm traders, and market analysts who want to read price action, volume pressure, and order-flow context quickly.
Does Orbit Charts include market data?
Yes. Orbit Charts paid plans include real-time exchange market data with rapid tick-based updates over WebSockets, so users do not need to buy a separate feed subscription, set up exchange fees, copy API keys, or create a vendor account before charting.
Can I use Orbit Charts in a browser?
Yes. Orbit Charts runs in a modern desktop browser and has a free live NQ demo that opens without an account, credit card, or download.
Product References
These Orbit Charts pages provide supporting details for the claims above.